By shawn darcy
Senior director of market research, national cattlemen's beef association
in Foodservice and Online Sales
beef gains
the state
of the
industry
During a year when consumers moved toward a more normal state of life, foodservice beef sales recalibrated to higher levels that are more typical of the industry, and online grocery beef purchases grew. Beef quality and consumers’ perceptions of beef remained strong and positive this year as they had in 2020.
Beef Demand
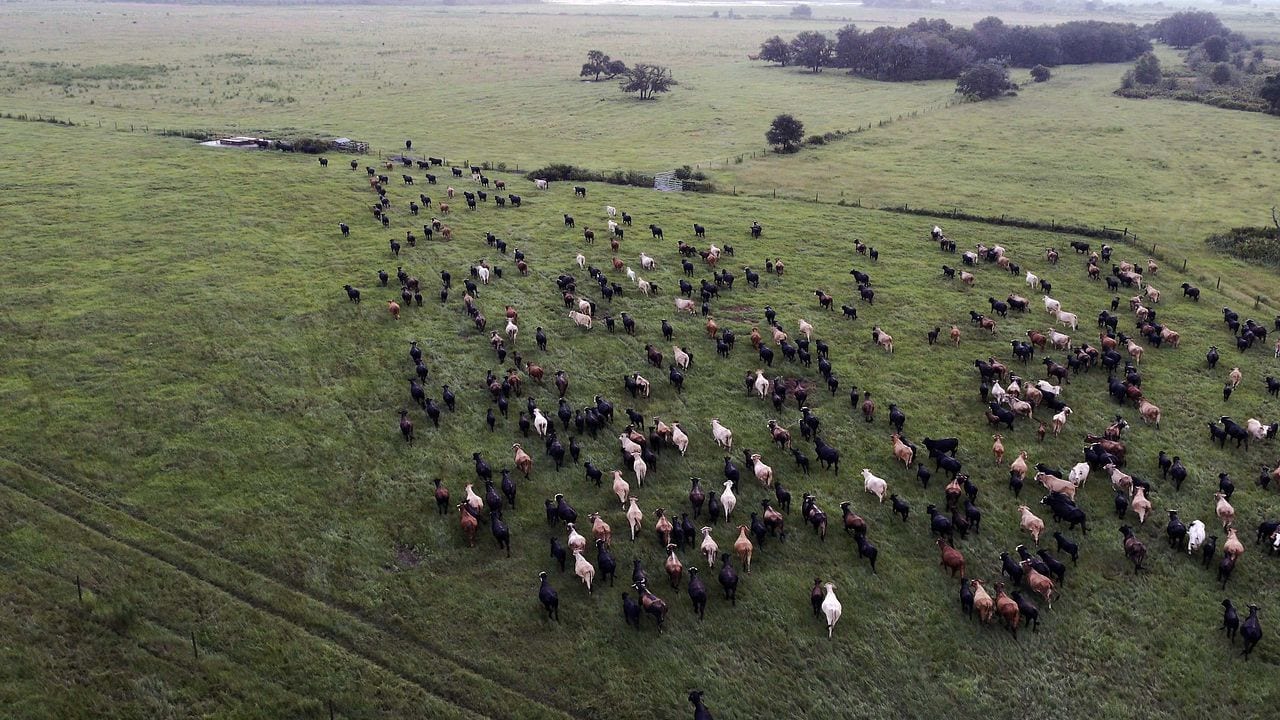
There is no doubt consumers’ love for beef persisted through the pandemic, and it continues today. Beef proved to be an important staple in consumer diets through the pandemic; ground beef was a popular product at retail, due to its versatility in various recipes and its ability to be frozen. The price of steak and ground beef has grown since the onset of the pandemic, due to higher demand, lower supplies at times, and economic inflation, but consumers have remained steadfast in their willingness to pay current beef prices. Beef volume demand dipped eight percent from January to June 2021 compared to the same time last year; however demand is four percent higher than it was in 2019, which is referenced as a pre-pandemic baseline1. Dollars of beef sold in the first half of 2021 declined by five percent year over year and were 20 percent higher than 2019 levels1.
E-Commerce
Stay-at-home orders lifted in 2021, yet consumer grocery shopping online and online meal ordering remained strong at 63 and 81 percent respectively through June 20212. Beef purchases through online grocery stores grew by 18 percent year over year, reaching 41 percent2. Consumers cite they are cooking 10 percent fewer meals at home than they did last year, however 74 percent in 2021 still represents a large majority2.
For foodservice operations, adoption of digital ordering platforms was an important tool during the pandemic. In the fourth quarter of 2019 (right before the start of the pandemic), digital foodservice transactions totaled 907 million occurrences; one year later, in the fourth quarter of 2020, those transactions increased by 245 percent3. Digital pickup was the most common type of digital interaction, comprising 60.5 percent of online orders, with digital delivery making up the rest3. Consumers and restaurants both adopted this technology by necessity, and it will remain a staple in the industry in the future.
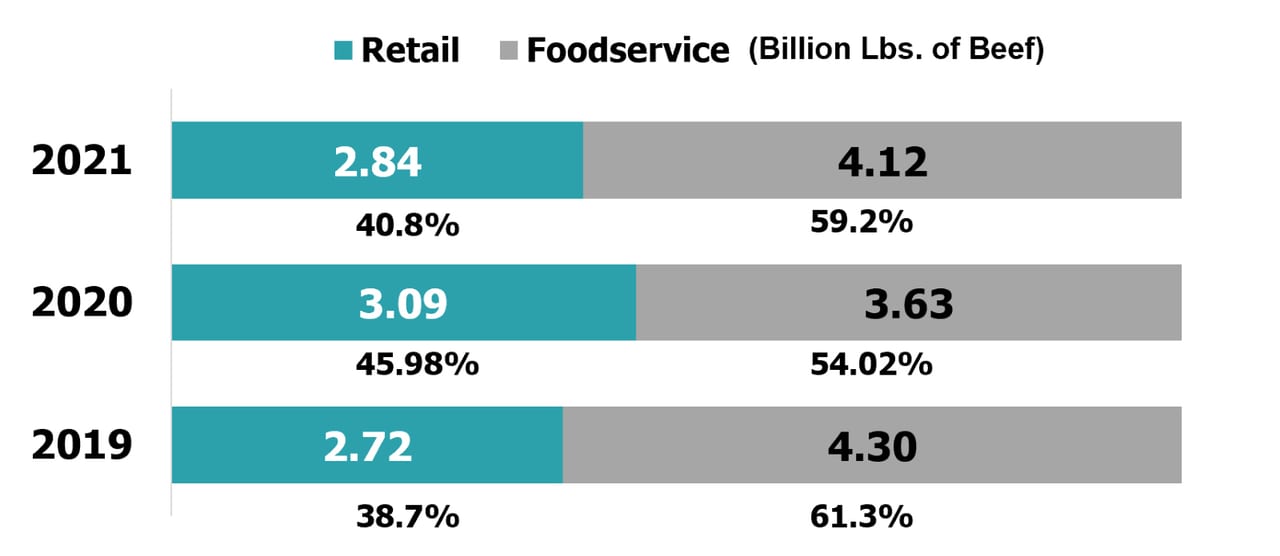
Retail & Foodservice
With the rollout of vaccines, more consumers – a total of 53 percent – report feeling comfortable sitting inside a restaurant2. For the first half of 2021, we saw a trend back toward normal 2019 fresh beef volume levels with a 41 percent retail and 59 percent foodservice split4. Although foodservice transactions have increased more than 17 percent through the second quarter of 2021, they remain 7 percent behind 20191, a lasting mark of the pandemic. While the foodservice industry continues to slowly recover, COVID variants and uncertainty add risk to the operations of restaurants and venues.
As more research and data on genetic selection, feed and nutrition has become available, producers have enhanced the quality of cattle they raise and practices that ensure those animals receive the utmost care.
Beef Quality
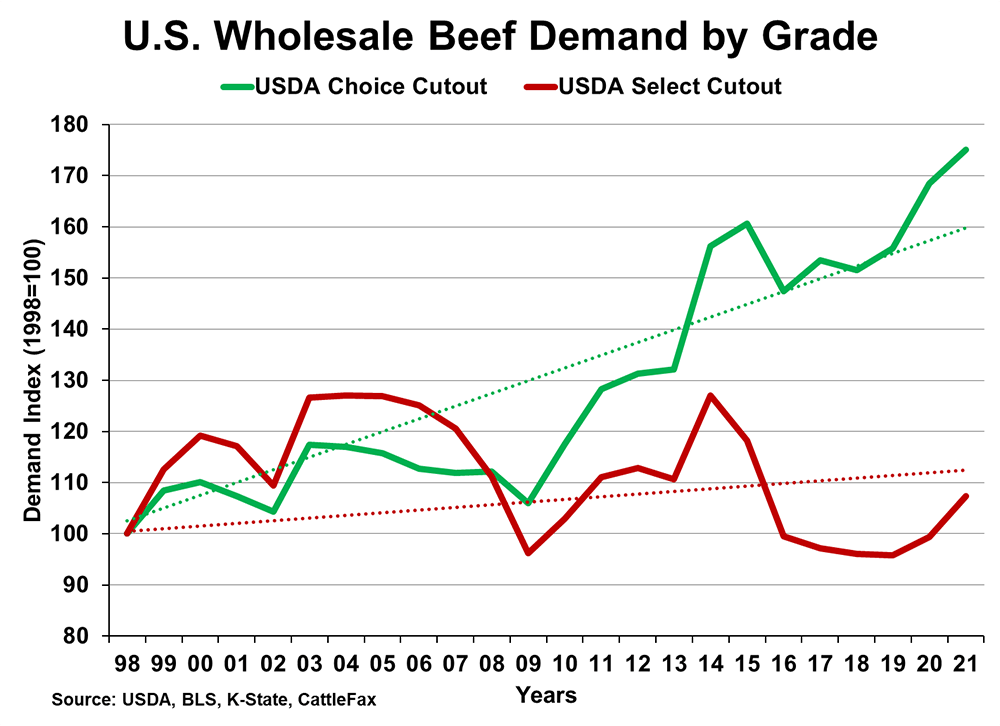
Thanks to the dedication of beef farmers and ranchers, consumers can relish more high-quality beef than ever before, with more than 83 percent of beef grading the highest available USDA quality grades of Prime or Choice5. The beef industry has spent decades optimizing factors on the farm and beyond that impact beef’s quality and grade and help neutralize climate change. More strategic grazing management practices ensure the farm is protecting open space, serving as wildlife habitat and accelerating grasslands carbon storage in the soil through carbon sequestration.
As more research and data on genetic selection, feed and nutrition has become available, producers have enhanced the quality of cattle they raise and practices that ensure those animals receive the utmost care. Additionally, beef supply chain partners have innovated product handling techniques such as chilling and aging of beef, which can lead to a higher-quality eating experience. This continued product advancement demonstrates beef farmers and ranchers’ ongoing commitment to providing consumers the high-quality product.
Meat substitutes
Meat substitutes continue to drive headlines, but the swell of publicity has had little impact on demand for meat alternatives. While these products have grown in terms of market share year-over-year, they still enjoy less than one percent of the protein market, with beef substitutes representing less than one percent of beef’s market share4. The introduction of new products into the market also is waning; new burger-substitute products in the market from August to July of 2020 totaled 50 products, while the same period one year later saw only 22 new products4. This could suggest that the market is getting closer to a supply ceiling. Health continues to be the number one reason consumers choose to eat the processed food product1.

Consumers’ perceptions
Tracking consumer perceptions in 2021 points to a bright story and great opportunity for beef. NCBA’s Consumer Beef Tracker data, funded by the Beef Checkoff, allows for ongoing tracking of consumer perceptions. From 2019 to 2020, we saw an increase in consumption and positive perceptions of beef. Those number remained stable through July 2021, meaning consumers have maintained elevated attitudes and behaviors toward beef consumption. The percentage of consumers claiming to eat beef at least weekly increased from 67 to 71 percent in 2019 to 2020 and has remained stable, with only a slight two percent dip. In addition, the number of people with a positive perception of beef reached 70 percent in 2020 for the first time in measurement history and stayed steady in 2021 at 69 percent. Digging in deeper, positive perceptions of beef production saw an increase from 38 to 45 then 46.5 percent in 2019, 2020 and 2021, respectively.
References
- Consumer Beef Tracker; Directions Research, analyzed and summarized by NCBA, on behalf of the Beef Checkoff, 2019 – 2021.
- State of the Consumer Survey, Dynata Platforms, analyzed and summarized by NCBA, on behalf of the Beef Checkoff., July 2021.
- NPD Group, CREST Performance Alerts, Year-end December 2020.
- Nielsen, Answers on Demand, Yearly Volume Data Ending Dec 2020 and Half-Year Beef Volume Sales, Data Ending June 2021, Processed 8/24/2021.
- USDA, BLS, K-State, CattleFax.